 A little more than a month ago, I went through a huge life-change: I left my corporate job to focus on Humor That Works full-time.
One of the most challenging adjustments to working for yourself comes from lack of structure–you no longer have a set schedule where you are expected to be in an office during specific hours and no one checks up on you to make sure you’re actually doing work.
While I definitely welcome this freedom, I wanted to make sure I didn’t waste my time away catching up on TV shows I’ve missed (I’m just discovering that Parks and Rec is a really good show) or getting sucked into the 3600 hours of streaming Olympic coverage.
Thankfully friend and fellow improviser, Matt Shafeek, announced an awesome challenge for July. The challenge was called Create / Consume and it was a huge help in keeping me productive with my free schedule.
The Create / Consume Challenge
The concept of Create / Consume is simple: for an entire month, spend more time creating than consuming. As far as rules go, that’s it. What you define as creating and consuming is up to you. How you track your time is up to you. The rewards for completing the challenge, also up to you.
That said, Matt does share some tips and tricks on the Create / Consume site, as well as the rules for him personally. The most important thing is finding a process that works for you and identifying the things you want to do more of (creating) and what you want to make sure you limit (consuming).
My Create / Consume Rules
Matt and I are similar in that we both work on a lot of different things, we’re both improvisers and we both love measuring our productivity. And yet we managed the challenge slightly differently.
While Matt used a timer on his phone to track time, I estimated the time I spent on various activities at the end of each day. While this isn’t as accurate, it was easier for me and meant that I actually stuck to the program (more accurate numbers aren’t helpful if you always forget to press start on your timer).
My list of creation and consumption is similar to Matt’s: anything that builds towards one of my key goals was marked as creation–even if it was technically consuming something.
As an example, doing research for a blog post may be “consumption” because I’m reading instead of writing, but it’s done with the intention of helping me create (as opposed to the consumption of reading for pleasure, such as reading A Bad Idea I’m About to Do for fun).
Here’s how I defined the 4 categories listed on the Create / Consume site (Creation, Consumption, Gray, Neutral):
Creation
These activities are related to helping me achieve one or multiple goals that I’ve established for myself.
- Writing — blog post, chapter for my book, creating a new presentation
- Performing –on stage for improv, stand-up, storytelling
- Coaching — improv, individual clients
- Practicing — improv, stand-up, storytelling
- Training — humor in the workplace, improv, interview skills
- Planning — for Humor That Works, ComedySportz (CSz), general business
- Researching — necessary / relevant info for writing
Consumption
These activities are related to me decompressing and taking in content created by other people.
- Browsing — the Internet
- Watching — TV, Movies, LiveStreaming Olympic Coverage
- Reading — newspapers, books, magazines (for pleasure, not research)
Gray Area
These activities could fall into both creation and consumption. The biggest example here is watching improv: a lot of the improv I watch is because I am performing later in the same show or am there to support the community. I often watch improv with an eye for what I would do if I was performing / what made people laugh but it’s still not the same as creating improv magic myself. Thus, gray area.
- Watching — Improv shows
- Networking — with new people or old acquaintances
Neutral
These activities don’t really fit in either category, though after a month of tracking, I might consider moving Exercising to Creation and Email to Gray. Items that were neutral meant that I didn’t track them at all (though the data analyst inside me wished I did).
- Emailing — reading, writing, organizing
- Exercising — working out, playing sports, running
- Cooking / Eating — food & beverage
- Socializing — with friends
- Sleeping
Results
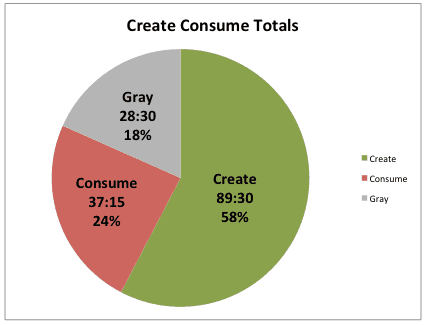
So how were the results of my first month of tracking? Not too shabby. I successfully completed my goal of creating more than I consumed (89 hours creating vs 37 hours consuming vs 28 hours of gray-area):
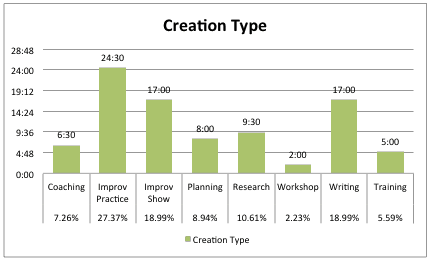
 Taking a look at my Creation, you can see a majority of it came improv (Practice at 24.5 hours and Shows at 17 hours, with writing at #2 with 17 hours).
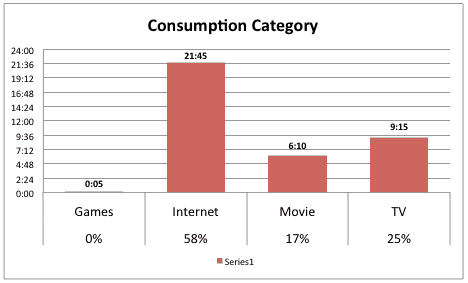
And now looking at Consumption, the main categories were Internet, TV and Movies (oh and a whopping 5 minutes if playing Word Warp on my iPod). The scary part about Internet usage was that, when it came to Consumption, 90% of my time was spent on Reddit, ESPN and Facebook. As for the TV / Movies, the majority was Parks and Rec plus re-watching Independence Day and seeing The Dark Knight Rises.
Looking at the Gray Area results, everything was entirely from watching improv shows (meaning I saw 28.5 hours of improv in the month of July).
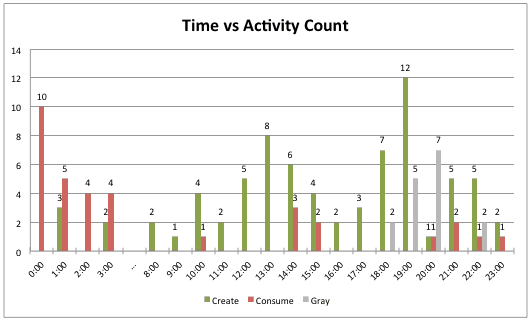
Another point of interest for me was regarding time-of-day: when am I most productive and when do I decompress. As you can see in the graph below, middle of the day is the most productive time while late at night is when I do most of my consumption.
Key Insights
Based on the above analysis and some additional number crunching behind-the-scenes, here are some of the interesting things I learned about my creation and consumption in July:
- I’m happy with my first month of tracking. Almost at a 60/40 ratio is a good start, though I do want it to get better. For August, I’m going to shoot for a 70/30 split.
- The single activity I spent the most time on was browsing the Internet at 20:15, followed by Watching CSz Matches at Championship (13:oo) and teaching CSz Workshops (12:30). The first Humor That Works related activity was at #5 with working on a specific training at 7 hours and 45 minutes.
- The activity with the greatest average time per instance (so the average length I spent on an activity non-stop) was Parks and Rec (3 hours 37 minutes per session aka 2 binge sessions to finish Season 4), followed by Watching CSz Matches at Championship (3:15), watching movies (Independence Day and The Dark Knight Rises both around 3:05) and facilitating a training (3:00).
Based on the analysis, the key actions I want to take include:
- Dedicating more time to Humor That Works. For July, 67% of creation time was dedicated to Comedy (which includes improv performance and shows) while only 23% was dedicated to Humor That Works. Granted this was a special month for comedy (lots of private shows and ComedySportz Championship in Chicago), but good to keep an eye on.
- Not spend so much time browsing the web. I spent 20 hours on various websites, but 0 hours reading a book for pleasure. That’s pretty sad. As is the fact that my #1 activity out of everything I did was browsing the Internet.
- Getting more focused during the day. My peak productivity seems to be between 1pm and 7pm–for August I may look at embracing that and seeing if I can get more accomplished by focusing on bigger / more important projects during those key hours.
- Going to bed earlier instead of wasting time. Most of my consumption came after midnight. That means I’m up wasting time doing nothing instead of sleeping. If I went to bed, I could get up earlier and possibly add a few hours to my productive mid-day.
- Track more! I love being able to go through all of this data, but I’m sad I don’t have additional details such as the amount of time spent on email, working out and eating. I just have to make sure I find the balance between getting good data and tracking way too much detail…
Summary
So what was the biggest benefit of all this? For me it was giving me insight into how I work and keeping me honest about how I’m spending my time. By having the data in front of me, I can make strategic decisions on things I want to keep or change (such as less time on the Internet).
But perhaps the greatest thing about doing this challenge was that simply knowing I was tracking my time influenced my behavior for the better. Early on when I didn’t have much “creation time” reserved, I did less consumption because I didn’t want to tip the scales. That alone was worth implementing the system.
For those of you with creative ambitions, I recommend you give it a try. You certainly don’t have to keep as strenuous of logs, nor do you have to go into as much analysis, but it is an interesting challenge to at least try for a month.
If you have any questions, let me know. If you have any recommendations on how to track time spent on all of these different activities, definitely let me know as well.
